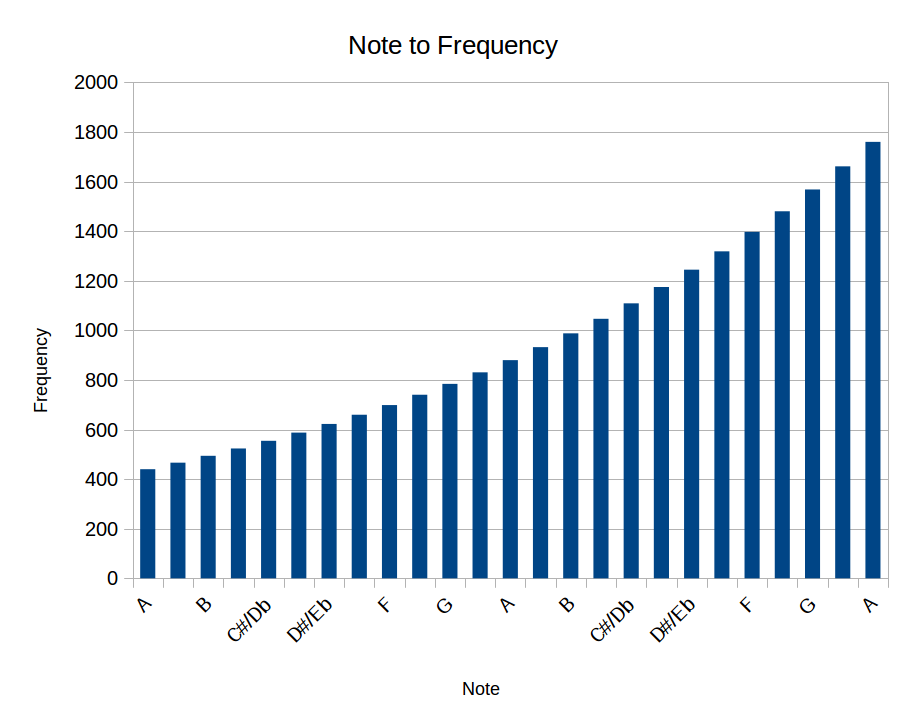
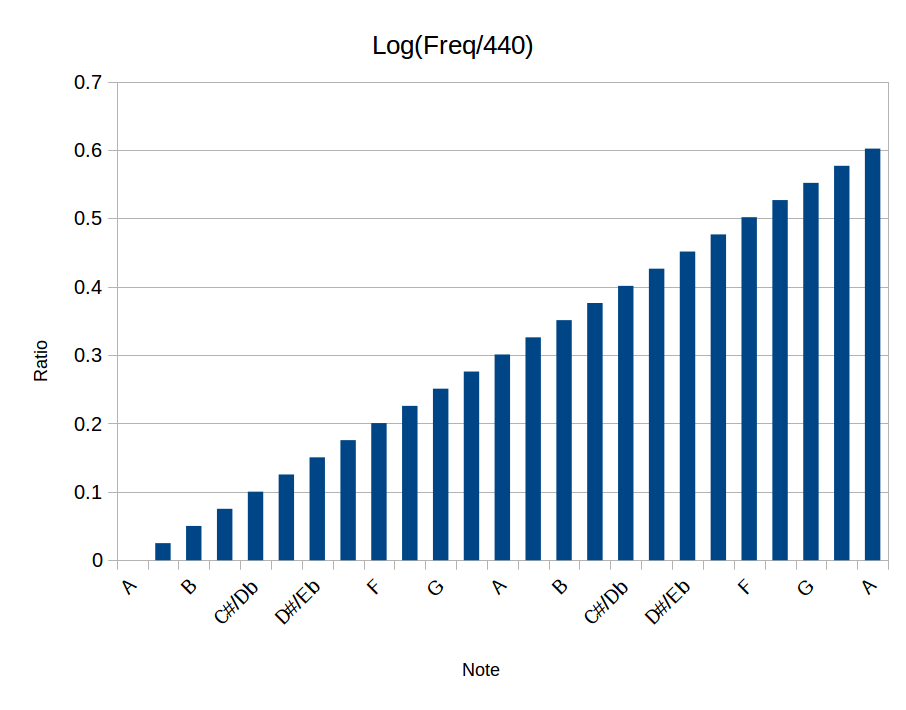
The underlying question is why do you perceive frequency in this way, on a logarithmic scale?
But an even deeper question, lurking under this, is whether it's even appropriate to call it frequency, when it is perceived this way?
There are two varieties of analyses used in signal processing: time-frequency analysis (which essentially uses a linear scale for frequencies) and time-scale analysis (which uses "scale" in place of "frequency", which might be regarded as frequency as seen on a logarithmic scale). The respective diagrams are termed spectrograms and scalograms; and the archetypes used for the respective varieties of analyses are the windowed Fourier transform (or short-time Fourier transform) and the wavelet transform.
(Note: I and a lot of other people get the terms confused and also use the words spectrograph and scalograph.)
As to the other question - of how it is perceived this way - it's a little-known fact that Gabor, in his pioneering paper on the windowed Fourier transform:
Theory Of Communication
Journal of the Institution of Electrical Engineers (1946)
https://jcsphysics.net/lit/gabor1946.pdf
wrote up a whole section on human auditory perception, citing the logarithmic nature of the perceived frequency scale, and laying out some of the details behind the mechanism of how it arises.
Ironically, he went against his own analysis - flat-out ignoring the ramifications of it - when laying out the details of spectrograms and of the windowed Fourier transform! He's the guy who came up with it.
Here is an example of a sound and music segment in the time-frequency plane. A spectrogram:
Tom Jones clone?
As demonstrated, they can be played back; but this spectrogram (like most others) shows only amplitudes and not phases, and to do it correctly, phases should also be present (or else reconstructed).
Apparently, Gabor started the whole enterprise in 1946.
But, in so doing, he missed the boat - missing out on the key elements of the discovery of a different form of analysis that would have to wait nearly a half-century more to arise: scalograms.
And this is where we get to your question.
He went against his own analysis by tacitly posing the assumption that the time-frequency plane be divided up in regions of constant window size, so that if t represented the time coordinate and f the frequency coordinate, then the windows would be of fixed size Δt and Δf (with there being a natural constraint that Δt Δf = 1 (he called a cell of width Δt and Δf a "logon" - that term never stuck). It is perfectly fine, however, to "oversample" by taking products larger than 1, just redundant - strictly speaking. Audacity, for instance, uses Δt Δf = 2 for its spectrographs. Consequently, this goes naturally with a frequency scale for f that increases by fixed increments Δf - a linear scale.
And ... that's a bad idea.
People in Linguistics, for instance, are quite aware of this, and of the limitations; the chief of which is that a windowing size well-adapted for lower frequencies is poorly suited for higher frequencies, and vice versa. But they still use Gabor's method for analysis.
Here, in detail, is why it's a bad idea.
The information conveyed by a waveform is conveyed by its shape. If you stretch out the shape by, say, doubling its duration and halving its speed, then it will convey the same information - but at half the original speed. Likewise, if you squeeze the wave into a time period half as large, then it conveys the same information at double the speed.
Consequently, the optimal spacing for windows in the time-frequency plane should not be constant, but should be adapted to the rate which information is conveyed at, at that frequency. That means it should be such that Δt increases in proportion to the period of the wave, or - to say the same thing differently - that Δt should have a width inversely proportional to f. By virtue of the constraint, Δt Δf = 1, that means that the spacing for Δf should be proportional to f, itself. With that type of spacing, an octave is spanned by an equal number of increments and the scaling is logarithmic.
Consequently, the optimal spacing for the time-frequency plane would have f being on a logarithmic scale, not a linear scale; so you're no longer actually talking about a time-frequency plane anymore, but a time-scale plane.
Biological creatures have adapted to this optimal way of perceiving sound - and that's why you perceive frequencies on a logarithmic scale.
If Gabor had taken his own analysis to heart, instead of devising the windowed Fourier transform, it's quite possible he may have ended up stumbling onto what we now term the continuous wavelet transform, or some discretized version of it, as this is the primary means of constructing a time-scale representation of a signal.
Note that I said "primary means". In the usual formulation of the wavelet transform, the same windowing function is used in both the forward and backwards direction (spectrographs can be converted back to waveforms - provided you keep the information about the phase, not just the amplitude; a similar observation applies for scalographs). This puts a roadblock in the way of certain natural windowing functions (like the cosine window or Gaussian). Gabor used Gaussian windows. Consequently, windowing functions for wavelet transforms have some really kooky and arcane shapes.
It is quite possible to do scalographs that use different windowing functions for the forward and reverse transforms - the analysis and synthesis stages. In so doing, one can, indeed, use Gaussian windowing functions or cosine windows (on a logarithmic scale) in the forward direction, and simplify the reverse direction by using a trivial windowing function (or even no windowing at all; i.e. a constant function!)
This is the case for both the continuous and discrete transforms. With the right choice of functions, it's even possible to do scalographs, without any frequency analysis (i.e. in the time domain), though the windowing will not be as good and the results a little more messy. A brief demo:
A Scalograph Demo


