This answer can hopefully be useful as an additional perspective on top of the existing ones.
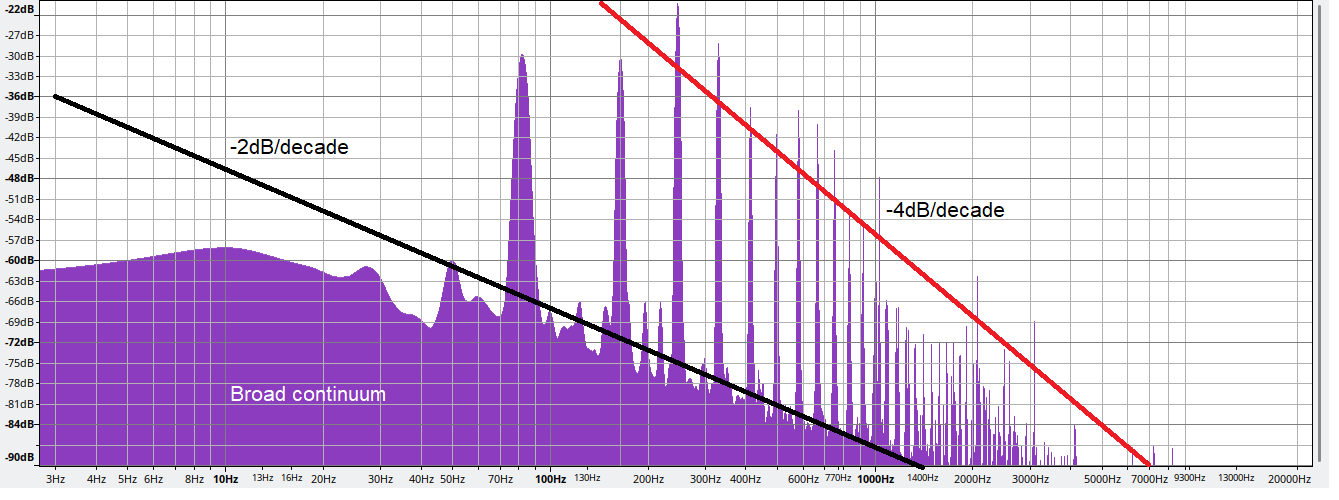
Note that the spectrograph is a plot of (the log of) power output vs frequency (power being energy per unit time). It appears that the fundamental harmonic has been "washed out" into the broad background at low frequency, and perhaps broadened (it's hard to tell because the frequencies are on a logarithmic scale).
There are many reasons why this may be, which could depend on, as others have said, things like where and how you pluck the string, how the other strings and the body of the guitar resonate, and the actual composition and behavior of the string itself. The key point, however, is that the "fundamental frequency" (82 Hz) does, in fact, contain the majority of the power output, but that strings do not actually act like a perfect, ideal string treated in an elementary physics course. There are non-linear corrections to the perfect string behavior which depend on the actual tensile properties of the string (ideal strings do not stretch, for example), as well as the resonant effects of the other strings and the body of the instrument, all of which contribute to the "timbre" of the instrument and contribute to the rich sound. While for a perfect string one would expect perfect peaks at multiples of the fundamental frequency (delta functions for you math nerds), all of these complicated, non-linear corrections contribute to the broadening of the peaks, and how much each peak broadens depends on the frequency (which we physicists call dispersion). In this case, it appears that the fundamental frequency peak is possibly broadened, while the higher frequencies are much sharper, and furthermore than a lot of the power in the low-frequency end of the spectrum has been significantly spread out over a broad range, so the low-frequency modes are much more dispersive than the high-frequency ones (this is why you have the broad continuum background at low frequencies which tapers off at higher frequencies). Perhaps others can speculate as to what causes larger dispersion at lower frequencies.
I quickly played around with this, and we see something interesting,
As shown in this Physics.SE answer, we would expect that the amplitudes of the harmonics go as the inverse of frequency squared. The power delivered is proportional to the square of the amplitude, and so would go as 1/frequency to the fourth power. I have indicated this by the red line on the spectrograph. Following that red line to lower frequencies would give a rough estimate of the expected height of the fundamental frequency if the string were perfect and there were no resonance effects. However, it appears that the fundamental and to a lesser extent the first harmonic (164 Hz) have been broadened and their "spectral weight" has been spread out across a broad range of frequencies at the low end. It's curious that this effect seems to decay as the inverse of frequency squared, indicated by the black line. I don't have an intuitive explanation for this behavior, but I am sure someone could take a stab at that.

